ARTICLE
Vol. 133 No. 1521 |
Ethnic differences in cardiovascular risk profiles among 475,241 adults in primary care in Aotearoa, New Zealand
Cardiovascular diseases (including diabetes) account for 17% of health loss among people living in Aotearoa, New Zealand. There have been considerable reductions in the incidence and mortality of cardiovascular disease (CVD) in New Zealand over the past 20 years through good prevention and access to treatment.
Full article available to subscribers
Cardiovascular diseases (including diabetes) account for 17% of health loss among people living in Aotearoa, New Zealand.1 There have been considerable reductions in the incidence and mortality of cardiovascular disease (CVD) in New Zealand over the past 20 years through good prevention and access to treatment.1–3 For ischaemic heart disease (IHD) and stroke, hospitalisation and mortality rates have fallen in all demographic ‘groupings’ including gender and ethnicity, with a smaller decline in IHD rates in Pacific peoples than other ethnicities6 and a larger decline in stroke rates for Indian people than other ethnic groups (unpublished). However, the burden of CVD is unevenly distributed across New Zealand by ethnicity, with Māori, Pacific and Indian people experiencing a greater burden of this condition than other groups.4–8 This increased burden of CVD is one of the main drivers behind the 6–7 year lower life expectancy experienced by Māori and Pacific people at birth compared with other groups in this country.4,5 There is a need for continued focus on CVD given the magnitude of health loss associated with CVD and the potential avoidability of this burden through prevention and treatment.1
The Ministry of Health states that “In Aotearoa New Zealand, people have differences in health that are not only avoidable but unfair and unjust. Equity recognises different people with different levels of advantage require different approaches and resources to get equitable health outcomes.”9 More research to understand CVD disparities, including the contribution of inequities9 in healthcare access and quality, is required to develop and implement effective equity-promoting interventions and ultimately reduce CVD burden across ethnic groups. Although self-reported data on CVD risk factor levels by ethnicity are available through national surveys, the numbers in non-European ethnic groups are generally small, and the availability of data from primary care is limited. The PREDICT-CVD cohort is a very large, contemporary, representative and ethnically diverse cohort recruited at the time of CVD risk assessment in routine primary care practice in New Zealand.10 The aim of this study was to describe and compare the baseline CVD risk profiles of people in the PREDICT-CVD cohort by ethnicity. The study does not directly document access to, or quality of, CVD care.
Methods
Design, setting and entry
This was a cross sectional study. People were entered into the cohort the first time their CVD risk was assessed by their primary care clinician (physician or nurse) entering data into PREDICT, a web-based decision support programme integrated with electronic primary care practice management systems in New Zealand.10 The programme enables available clinical data in the electronic medical record to auto-populate fields, and the data template has a number of compulsory fields and built-in range and validity checks at the point of data entry. These factors facilitated accurate and nearly complete (>99%) data collection for variables required in the CVD risk prediction equation used in New Zealand at the time.10 This equation was based on a Framingham risk equation with adjustments for groups whose CVD risk may be underestimated by that equation (eg, family history of premature CVD; Māori, Pacific or Indian ethnicity).11
Since 2003, New Zealand CVD risk management guidelines have recommended that men aged over 45 years and women aged over 55 years (or 10 years earlier for subpopulations at increased risk: those of Māori, Pacific or Indian ethnicity and individuals with known CVD risk factors) have a regular CVD risk assessment.11 Whether a person visiting the primary care clinic is risk assessed, and therefore whether they enter the cohort, is at the discretion of the primary care clinician. Most primary care physicians receive alerts through their electronic practice management system (PMS) advising them of individual patient eligibility for CVD risk assessment.10
Data up to 2015 indicate that approximately 90% of people eligible for CVD risk assessment (according to national guidelines12) in practices using the PREDICT programme had their CVD risk assessed using this software.10 National coverage data show Māori, Pacific and Indian ethnicities had slower increases in coverage compared to other ethnicities and at the end of 2015 there was a reported 4% gap in coverage between Māori and non-Māori.13 This programme is implemented in approximately 35% of New Zealand primary care practices, which serve approximately 1.6 million people (around 35% of the New Zealand resident population).10 The practices include all Northland primary care practices, approximately 80% of all practices in the Auckland region and some further practices in both the North and South Islands. The decision to participate in PREDICT was made at the PHO level, not the individual practice level, so the probability of selection biases at the practice level is low. The practices participating in PREDICT include large rural and urban areas and include the largest Māori, Pacific, Indian, Chinese and other Asian populations in New Zealand. It is unlikely that significant population subgroups are not represented in this study. The only exclusion criterion for the PREDICT programme is current pregnancy, and no decision support is given for those under 18 years of age.10
Study entry occurred between 20 October 2004 and 31 December 2016.
Participants and exclusion criteria
All people who received CVD risk assessment in primary care using the PREDICT programme were considered for inclusion in this study. People were excluded from this analysis if they were outside an age group in which CVD risk assessment is recommended (ie, aged less than 35 years or 75 years or more).
Data sources and linkage
Data on cardiovascular risk factors (including age, sex, smoking status, diabetes status, blood pressure, body mass index [BMI] and cholesterol levels) and medical history (including CVD and atrial fibrillation [AF]) were obtained during CVD risk assessment in primary care. These data were automatically stored both in the PMS and anonymously on a central database. With the permission of clinicians, the central database risk profile was regularly linked to an encrypted National Health Index number, a unique personal identifier which was used to anonymously link individual risk profiles to national and regional health databases.
National health databases were used to obtain or update participant data on demography (age, sex, ethnicity and socioeconomic deprivation),14 publicly funded hospitalisations (from 1988 onwards),15 and subsidised pharmaceutical dispensing (from 2005 onwards).16
Ethnicity was self-reported within the PMS and triangulated with PHO enrolment and hospitalisation databases. For those in whom more than one ethnic group was recorded, a prioritisation output method was used to assign each individual to one ethnic group. This prioritisation method was modified from that outlined in national ethnicity data protocols and prioritised groups in the following order: Māori > Pacific > Indian (including Fijian Indian) > Other Asian (including Chinese) > European > Middle Eastern/Latin American/African (MELAA) > Other > Unknown.17 National ethnicity data protocols in use during the study period enabled identification of Indians (who comprise 90% of South Asians in New Zealand) but non-Indian South Asians were unable to be differentiated from the rest of the Other Asian group. People whose ethnicity was MELAA, Other and Unknown were excluded because of the small numbers (<1,000) within each group.
The definitions of risk factors are provided in the Appendix.
Statistical methods
Continuous variables were summarised as means with standard deviations, and categorical data as frequencies and percentages. Summaries for continuous and categorical data were age-adjusted (unless otherwise specified) using the WHO world standard population.18 Potential differences between ethnic groups in means or proportions were tested using ANOVA or the chi-squared test, respectively, with the level of statistical significance set at p=0.05. Data were extracted using R version 3.5.0 (http://cran.r-project.org/), age-adjusted summaries were obtained using Microsoft Excel Version 2016, the chi-squared test was calculated using the online calculator Social Science Statistics19 and the ANOVA test was calculated using the online calculator at http://statpages.info/anova1sm.html.
Ethics approval
The PREDICT study (under which this research was conducted) was approved by the Northern Region Ethics Committee Y in 2003 (AKY/03/12/314) with subsequent annual approval by the National Multi Region Ethics Committee since 2007 (MEC07/19/EXP). Participant informed consent was not obtained, consistent with a waiver granted by the Ethics Committee, as the study involved secondary use of patient data that was anonymised prior to being received by the research team.
Results
A total of 206,508 women (mean age 57 years, SD 8.7 years, Table 1) and 268,733 men (mean age 53 years, SD 10.1 years, Table 2) were risk assessed between 20 October 2004 and 31 December 2016. The cohort comprised Māori (14%), Pacific (13%), Indian (8%), other Asian (10%) and European (55%) people. Mean age among Europeans was higher than that for Māori, Pacific and Indian women and men, due to age-sex-ethnicity differences in national risk assessment criteria. Māori and Pacific women (46%, 57%) and men (44%, 58%) were much more likely to be living in areas of the highest quintile of socioeconomic deprivation than Indians (22%) and Europeans (11%).
Table 1: Cohort description by ethnicity using age-standardised values, women.

All values age-standardised (except for Number (%)) using the WHO world standard population.17
Fewer than 1% of values missing unless otherwise specified.
*p for difference between ethnic groups.
SD=standard deviation.
Table 2: Cohort description by ethnicity using age-standardised values, men.

All values age-standardised (except for Number (%)) using the WHO world standard population.17
Fewer than 1% of values missing unless otherwise specified.
*p for difference between ethnic groups.
SD=standard deviation.
Smoking was most common among Māori women (39%) and Māori and Pacific men (35% and 27%, respectively), and least common among Indian people (1% women, 10% men). Obesity was most common among Pacific (72% women, 62% men) and Māori (53% women, 50% men) and least common among Other Asian people (10% women, 9% men). Mean blood pressure (BP) was highest for Māori (130/81 [SD 17.3/10.5] mmHg in women, 131/82 [15.7/10.2] mmHg in men) and lowest for Other Asian people (123/76 [15.7/9.5] mmHg in women, 125/79 [14.4/9.4] mmHg in men). Similarly, the mean ratio of total cholesterol to high density lipoprotein cholesterol (TC:HDL) among women was highest in Māori (4.1 [1.23]) and lowest for Other Asians (3.7 [1.02]). Among men, mean TC:HDL was also highest among Māori (4.5, SD 1.34), as well as Indian people (4.5, 1.20), and lowest among Other Asian people (4.3, 1.13). Diabetes was most common for Pacific (38% women, 23% men) and Indian people (33% women, 24% men), and elevated for Māori (23% women, 18% men) and Other Asian people (21% women, 15% men) compared to European people (12% women, 9% men). Among all ethnic groups, diabetes was more prevalent in women than men. A history of atrial fibrillation, heart failure and all CVD were most common among Māori (women 3.7%, 5.4% and 8.1%, respectively; men 5.8%, 6.1% and 9.5%, respectively) and generally least common among Other Asian people (women 0.7%, 0.4% and 1.6%, respectively; men 1.1%, 0.6% and 2.8%, respectively). A similar pattern was evident for prior coronary heart disease among women (ranging from 5.6% for Māori to 1.0% for Other Asian people), whereas Indian men had the highest prevalence of previous coronary heart disease (7.8%) followed by Māori (7.2%), with Other Asian men also having the lowest prevalence (2.1%). Among Indian people, the burden of CVD was much more pronounced among men than women as compared to other ethnic groups.
Discussion
We have demonstrated major differences in CVD risk factors by ethnicity in a large, primary care cohort. Overall, Māori and Pacific people, followed by Indian people, have the greatest burden of CVD and its risk factors in Aotearoa New Zealand. Māori have the highest BP and rates of smoking, atrial fibrillation, heart failure and prior CVD, while Pacific people have the highest rates of obesity and, together with Indian people, the highest prevalence of diabetes. Indian men have the highest rate of previous coronary heart disease of all ethnic groups. In addition to having the greatest burden of CVD and its risk factors, Māori and Pacific people are also much more likely to be living in areas of the highest socioeconomic deprivation than other ethnic groups.
The proportions of the ethnic groups in this study are broadly similar to those from the 2018 national census among adults aged 30–64 years.20 The main exception to this is that our study had a higher proportion of Pacific people (approximately double) compared with the national Census. This is because the cohort was predominately drawn from the northern region of New Zealand in which the majority (65%) of Pacific people in New Zealand live.21 Second, national CVD risk assessment guidelines criteria recommend CVD risk assessment a decade earlier for Pacific (as well as for Māori and Indian) people than for other ethnic groups (and for men compared with women), because of their increased burden of CVD.11 This will have also contributed to the lower mean age of Māori, Pacific and Indian people and the greater number of, and lower mean age of, men compared with women in our cohort.
Strengths of this study were that: data were based on CVD risk assessments undertaken by primary care clinicians and supplemented with information from regional and national databases; the cohort was large, contemporary and ethnically diverse; and less than 1% of data were missing for all variables except BMI, which was unavailable in 19% of people. The cohort is likely to be representative of people in New Zealand in whom CVD risk is recommended as approximately 90% of eligible patients in the study practices were included and about 35% of all primary care practices in New Zealand were included in the study.11 In the future it should be possible to obtain data required for CVD risk assessment directly from electronic health records for the whole country. This will be feasible because electronic data across primary care are increasingly available and nearly 80% of adults attend their primary care physician in a year,22 although the level of missing data is likely to be greater than what has been achieved in this prospectively designed cohort study.
Similar overall rates of smoking and obesity among women and men were observed in this study to those from an ongoing national health survey among adults, based on self-report. Diabetes rates were much lower in the national survey than in those observed in our study among women (5.3% vs 17%) and men (6.5% vs 11%). This difference is likely to at least partially reflect the higher proportions of Pacific people in our study (as noted above), the inclusion of younger people (from age 15 years) and lack of age adjustment in the national survey, and under-reporting through self-report in surveys. As with our study, Māori and Pacific people experienced increased levels of all three risk factors (smoking, obesity and diabetes),22 and Indian people experienced increased levels of diabetes23 compared with other ethnic groups.
Internationally, inequities in exposure to CVD risk factors and consequent CVD outcomes are evident among Indigenous peoples, similar to the experience of Māori highlighted here. A review of CVD risk factors among Indigenous populations (including from Australia and the US, as well as New Zealand) found that Indigenous peoples experienced a greater burden of CVD events and risk factors (including smoking, obesity and diabetes) at much younger ages than non-Indigenous groups.24,25 A call for action to address CVD inequities for Māori in 2004,26 including the prevention and management of CVD risk factors, has yet to be fully realised. A 2010 review of interventions focused on reducing inequities between Indigenous and non-Indigenous people across a wide range of conditions only identified 19 intervention studies meeting Cochrane Effective Practice and Organization Criteria for methodologically adequate research design27 and only six of those studies focused on preventing or managing CVD risk factors.
Since that review, the evidence base has improved and interventions have been identified that are likely to improve CVD outcomes for Indigenous peoples (eg, health literacy programmes28), reduce inequities in CVD outcomes between ethnic groups (eg, fixed dose combination therapy29) or are currently being investigated to determine their likely effect on such inequities (eg, Indigenous health worker support30). There is an ongoing need to ensure adequate funding to support more high-quality Indigenous-led research into the effectiveness of interventions that achieve CVD equity for Indigenous Māori.
Similarly, research and implementation of effective interventions for Pacific people is also urgently needed, given their high burden of CVD risk factors, particularly diabetes, and the CVD inequities that are evident. Pacific people have migrated over many generations from island nations that have a special relationship and historical ties to this country. Our research group recently received a three-year research grant to investigate and improve access to CVD care that achieves equity for Māori and Pacific people, confirming the importance of this work. Research questions will address current gap in knowledge such as ethnic differences in first-response care and in drug prescribing proportionate to recommended indications.
The Indian population in New Zealand is predominantly comprised of relatively recent immigrants; the 2013 census indicated that 75% of Indians in New Zealand are overseas born, 90% of whom have been in New Zealand for less than 20 years. Despite the supposed health advantages associated with being migrants (the “healthy migrant effect”31), a history of CVD (mostly from coronary heart disease) was common and significantly high diabetes prevalence was observed in keeping with overseas studies among South Asians.32 The cardiovascular risk profile of Indian people is very different to that of Māori and Pacific people. BP, smoking levels and history of atrial fibrillation and heart failure are not currently increased compared with other ethnic groups in New Zealand, but this may change over time with acculturation. Using standard BMI cut-offs, the total proportion of overweight/obese Indian men was not marked and was somewhat higher among Indian women than the proportions observed among Europeans. However, at a given BMI, compared to European counterparts, Indians have a greater percentage fat mass, greater abdominal subcutaneous fat and greater visceral fat deposition.32 Together with other South Asian groups, they develop vascular-metabolic diseases at lower BMIs than the traditional thresholds for overweight and obesity. Hence, the American Diabetes Association and NICE in UK both suggest lower BMI thresholds for Indians than those used in this study.33 An analysis of New Zealand Health Survey data from 2011–2013 found that 56% of South Asian adults were obese and 17% overweight using ethnic-specific lower cut-offs, implying that our results may have under-captured the proportion of Indians (and also Other Asians) that are overweight and obese.23
Although guidelines recommend Māori, Pacific and South Asian people have their CVD risk assessed at the same, younger, age than other ethnicities, we found very different risk profiles between these groups, as noted above. Further research to understand the impact of immigration, country of birth and length of stay in New Zealand on the incidence and prevalence of CVD and diabetes for different ethnic populations is recommended, including for non-Indian South Asian peoples who can now be differentiated from the Other Asian group using recent data resources like the Statistics New Zealand Integrated Data Infrastructure. Such research will enable a more tailored response to the health needs of high-risk ethnic groups comprised of large numbers of migrants and can inform the nature and timing of preventive strategies such as CVD risk assessment, diabetes screening and health promotion.
The reasons for CVD inequities by ethnicity are complex and multifactorial.34 The differences in socioeconomic status are stark and highlight the importance of the social determinants of health in the creation and perpetuation of inequities for Māori and Pacific. Opportunities and privileges provided by income, housing and education are not evenly distributed in New Zealand. Due to the effects of colonisation, both historical and contemporary, non-Māori non-Pacific groups have higher median incomes and educational achievement than Māori and Pacific people.35,36 Institutional or structural racism37 is now recognised as a ‘social determinant’ that can adversely impact on health-promoting activities including health literacy and access to and through excellent and timely healthcare. While health providers generally have limited ability to change the social determinants of health, it is well within our remit to ensure that people’s rights to receive high-quality, responsive and culturally safe healthcare services are being met.33
Our study is the largest and most recent review of CVD risk profiles in Aotearoa New Zealand, and we have demonstrated significant ethnic inequities. In our experience, generic interventions to reduce smoking and obesity or manage diabetes across the ‘whole of population’ are prioritised over ethnic-specific programs. A ‘one-size fits all’ approach will simply not work to achieve equity of CVD and its risk factors in New Zealand. In addition to current generic population health and risk-based approaches, there is a need for the continuing development of interventions from the perspective of those experiencing inequities.26,38 We believe that more support, including strong political commitment, is required to ensure such interventions are resourced appropriately so that they are implemented, evaluated and, if effective, scaled up in order to increase their reach, and achieve equity.
Appendix
Appendix Table 1: Definitions of risk factors.


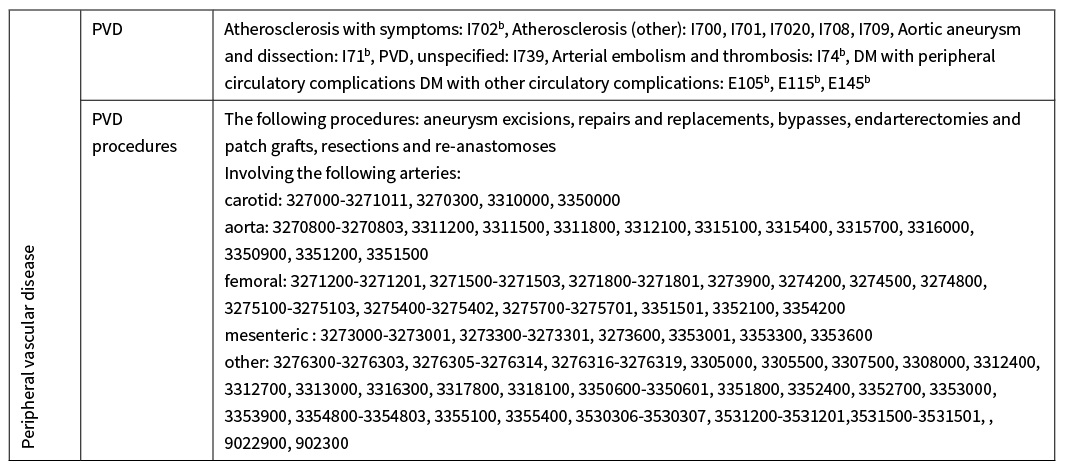
CABG=coronary artery bypass graft, CeVD = cerebrovascular disease, CVD=cardiovascular disease, CHD=coronary heart disease, IHD=ischaemic heart disease, MI=myocardial infarction, NHI=National Health Index, PTCA=percutaneous transluminal coronary angioplasty, PVD=peripheral vascular disease, TIA=transient ischaemic attack.
aSee Table 6 for ICD (International Statistical Classification of Diseases and Related Health Problems) codes used to identify relevant hospitalisations (principal and secondary diagnoses considered).
Appendix Table 2: ICD-10-AM codes used to identify history of CVD from hospital records.

Hospital records from 1 January 1988 to 31 December 2016.
CVD=cardiovascular disease, CeVD=cerebrovascular disease, CHF=congestive heart failure, DM=diabetes mellitus, ICD-10-AM= International Statistical Classification of Diseases and Related Health Problems, Australian Modification, IHD=ischaemic heart disease, MI=myocardial infarction, PVD=peripheral vascular disease, TIA=transient (cerebral) ischaemic attack.
aThese are the codes used by the Vascular Informatics Using Epidemiology and the Web (VIEW) team, Department of Epidemiology and Biostatistics, University of Auckland (at March 2016) to identify people with CVD from hospital records. Only ICD-10-AM codes were used because diagnoses and procedures were mapped by the Ministry of Health to ICD-10-AM 2nd edition (where mappings existed), as well as the original submitted ICD-9-CM-A /ICD-10-AM version.
bIncludes any subcategories that come after the last number, unless specified as excluded.
Aim
In Aotearoa, New Zealand, cardiovascular disease (CVD) burden is greatest among Indigenous Māori, Pacific and Indian people. The aim of this study was to describe CVD risk profiles by ethnicity.
Results
475,241 people (43% women) were included. Fourteen percent were Māori, 13% Pacific, 8% Indian, 10% Other Asian and 55% European. Māori and Pacific people had a much higher prevalence of smoking, obesity, heart failure, atrial fibrillation and prior CVD compared with other ethnic groups. Pacific and Indian peoples, and to a lesser extent Māori and Other Asian people, had markedly elevated diabetes prevalence compared with Europeans. Indian men had the highest prevalence of prior coronary heart disease.
Conclusion
Māori and Pacific people experience the most significant inequities in exposure to CVD risk factors compared with other ethnic groups. Indians have a high prevalence of diabetes and coronary heart disease. Strong political commitment and cross-sectoral action to implement effective interventions are urgently needed.
Authors
Vanessa Selak, Public Health Physician and Senior Lecturer, School of Population Health, University of Auckland, Auckland; Katrina Poppe, Senior Research Fellow, School of Population Health, University of Auckland, Auckland; Corina Grey, Public Health Physician, School of Population Health, University of Auckland, Auckland; Suneela Mehta, Public Health Physician and Senior Lecturer, School of Population Health, University of Auckland, Auckland; Julie Winter-Smith, PhD Candidate, School of Population Health, University of Auckland, Auckland; Rod Jackson, Public Health Physician and Professor, School of Population Health, University of Auckland, Auckland; Sue Wells, Public Health Physician and Associate Professor, School of Population Health, University of Auckland, Auckland; Daniel Exeter, Associate Professor, School of Population Health, University of Auckland, Auckland; Andrew Kerr, Cardiologist and Associate Professor, School of Population Health, University of Auckland, Auckland; Tania Riddell, Public Health Physician, ProCare PHO, Auckland; Matire Harwood, Associate Professor and GP, Department of General Practice and Primary Health Care, University of Auckland, Auckland.Acknowledgements
The authors would like to thank the primary healthcare organisations, affiliated primary care physicians, nurses and patients for their contributions to this study. The development of the study cohort is the result of a collaboration between epidemiologists and other clinical researchers at the University of Auckland, IT specialists at Enigma Solutions Ltd, primary healthcare organisations (and their member primary care physicians), non-governmental organisations (New Zealand Guidelines Group, National Heart Foundation, Diabetes New Zealand, Diabetes Auckland), several district health boards and the Ministry of Health. The PREDICT software platform is owned by Enigma Publishing (PREDICT is a trademark of Enigma Solutions Ltd). The study was funded by grants from the Health Research Council of New Zealand, Heart Foundation of New Zealand, and Healthier Lives National Science Challenge. The authors wish to thank Dr Geeta Gala, and Dr Roshini Peiris-John for reviewing the paper.Correspondence
Matire Harwood, Faculty of Medical and Health Sciences, University of Auckland, Private Bag 92019, Auckland Mail Centre, Auckland 1142.Correspondence email
m.harwood@auckland.ac.nzCompeting interests
The authors report grants from the Health Research Council of New Zealand, Heart Foundation New Zealand, Stevenson Foundation, to conduct this study.1. Ministry of Health. Health loss in New Zealand 1990–2013: A report from the New Zealand Burden of Diseases, Injuries and Risk Factors Study. Wellington: Ministry of Health, 2016.
2. Grey C, Jackson R, Wells S, et al. First and recurrent ischaemic heart disease events continue to decline in New Zealand, 2005–2015. Heart 2018; 104:51–7.
3. Ministry of Health. Historical mortality (1948–2016). Available from http://minhealthnz.shinyapps.io/historical-mortality/ [Accessed 6 May 2020]. Wellington: Ministry of Health, 2019.
4. Ministry of Health. Tatau Kahukura: Māori Health Chart Book. 3rd edition. Wellington: Ministry of Health 2015.
5. Ministry of Health. Tupu ola moui: Pacific health chart book 2012. Wellington: Ministry of Health, 2012.
6. Grey C, Jackson R, Wells S, et al. Trends in ischaemic heart disease: patterns of hospitalisation and mortality rates differ by ethnicity (ANZACS-QI 21). NZMJ 2018; 131:21–31.
7. Ministry of Health. Mortality 2016 data tables. Available from http://www.health.govt.nz/publication/mortality-2016-data-tables [Accessed 6 May 2020]. Wellington: Ministry of Health, 2020.
8. Grey C, Jackson R, Wells S, et al. Twenty-eight day and one-year case fatality after hospitalisation with an acute coronary syndrome: a nationwide data linkage study. Aust N Z J Public Health 2014; 38:216–20.
9. Ministry of health. Achieving equity. Available from http://www.health.govt.nz/about-ministry/what-we-do/work-programme-2019-20/achieving-equity [Accessed 17 April 2020] Wellington: Ministry of Health 2020.
10. Wells S, Riddell T, Kerr A, et al. Cohort profile: the PREDICT cardiovascular disease cohort in New Zealand primary care (PREDICT-CVD 19). Int J Epidemiol 2017; 46:22.
11. New Zealand Guidelines Group. Evidence-based best practice guideline. The assessment and management of cardiovascular risk. Wellington: New Zealand Guidelines Group, 2003.
12. Ministry of Health. Cardiovascular disease risk assessment. Updated 2013. New Zealand Primary Care Handbook 2012. Wellington: Ministry of Health 2013.
13. Ministry of Health. National Health Index data dictionary. Version 5.3. July 2009. Wellington: Ministry of Health 2009.
14. Ministry of Health. National minimum dataset (hospital inpatient events) data mart data dictionary. Version 7.8. February 2016. Wellington: Ministry of Health 2016.
15. Ministry of Health. Pharmaceutical claims data mart (PHARMS) data dictionary. Version 4.1. July 2012. Wellington: Ministry of Health 2012.
16. Health Information Standards Organisation (HISO). HISO 10001:2017 Ethnicity Data Protocols. Wellington: Ministry of Health 2017.
17. Ahmad OB, Boschi-Pinto C, Lopez A, et al. Age standardization of rates: A new WHO standard. GPE discussion paper series: No.31. Geneva: World Health Organization 2001.
18. Dawson CR, Hanna L, Jawetz E. Controlled treatment trials of trachoma in American Indian children. Lancet 1967; 2(7523):961–4.
19. Statistics New Zealand. 2018 Census. http://nzdotstat.stats.govt.nz/wbos/Index.aspx (accessed 10 January 2020). Wellington: Statistics New Zealand, 2018.
20. Ministry of Health. Tagata Pasifika in New Zealand [http://www.health.govt.nz/our-work/populations/pacific-health/tagata-pasifika-new-zealand [Accessed 6 July 2018; Last reviewed 31 January 2014].
21. Ministry of Health. New Zealand Health Survey. Annual data explorer. http://minhealthnz.shinyapps.io/nz-health-survey-2016-17-annual-data-explorer (Accessed 26 April 2019). Wellington: Ministry of Health 2017.
22. Scragg R. Asian Health in Aotearoa in 2011–2013: trends since 2002–2003 and 2006–2007. Auckland: Northern Regional Alliance Ltd, 2016.
23. Lucero AA, Lambrick DM, Faulkner JA, et al. Modifiable cardivoascular disease risk factors among indigenous populations Advances in Preventive Medicine 2014; 2014:547018.
24. Stoner L, Stoner KR, Young JM, et al. Preventing a cardiovascular disease epidemic among indigenous populations through lifestyle changes Int J Prev Med 2012; 3:230–40.
25. Bramley D, Riddell T, Crengle S, et al. A call to action on Maori cardiovascular health NZMJ 2004; 117:U957.
26. Paul CL, Sanson-Fisher R, Stewart J, et al. Being sorry is not enough. The sorry state of the evidence base for improving the health of indigenous populations. Am J Prev Med 2010; 38:566–8.
27. Crengle S, Luke JN, Lambert M, et al. Effect of a health literacy intervention trial on knowledge about cardiovascular disease medications among Indigenous peoples in Australia, Canada and New Zealand. BMJ Open 2018; 8:e018569.
28. Selak V, Harwood M, Elley C, et al. Polypill-based therapy likely to reduce ethnic inequities in use of cardiovascular preventive medications: Findings from a pragmatic randomised controlled trial. Eur J Prev Cardiol 2016; DOI: 10.1177/2047487316637196
29. Selak V, Stewart T, Jiang Y, et al. Indigenous health worker support for patients with poorly controlled type 2 diabetes: study protocol for a cluster randomised controlled trial of the Mana Tū programme. BMJ Open 2018; 8:e019572.
30. Hajat A, Blakely T, Dayal S, et al. Do New Zealand’s immigrants have a mortality advantage? Evidence from the New Zealand Census-Mortality Study. Ethnicity & Health 2009; 15:531–47.
31. Volgman AS, Palaniappan LS, Aggarwal NT, et al. Atherosclerotic cardiovascular disease in South Asians in the United States: Epidemiology, risk Factors, and treatments. A Scientific Statement from the American Heart Association. Circulation 2018; 138:e1-34.
32. Sattar N, Gill JM. Type 2 diabetes in migrant south Asians: mechanisms, mitigation, and management. Lancet Diabetes Endocrinol 2015; 3:1004–16.
33. Miner-Williams W. Racial inequities in cardiovascular disease in New Zealand. Diversity and Equality in Health and Care 2017; 14:23–33.
34. Pasifika Futures. Pasifika people in New Zealand. How are we doing? . Auckland: Pasifika Futures, 2017.
35. Simpson J, Adams J, Oben G, et al. Te Ohonga Ake: The Determinants of Health for Maori Children and Young People in New Zealand: Series Two. Te Ohonga Ake series for the Ministry of Health. Dunedin: NZ Child & Youth Epidemiology Service, University of Otago, 2015.
36. Jones C. Levels of racism: A theoretical framework and a gardener’s tale. Am J Public Health; 90:1212–5.
37. Harwood M, Tane T, Broome L, et al. Mana Tu: a whanau ora approach to type 2 diabetes. NZMJ 2019; 131:76–83.
