ARTICLE
Vol. 135 No. 1560 |
2021 Assessment of New Zealand district health boards’ institutional healthy food and drink policies: the HealthY Policy Evaluation (HYPE) study
An institutional nutrition policy can create more accessible and affordable healthy food and drinks, thereby positively influencing the dietary intake and preferences of staff and visitors, and ultimately decreasing nutrition-related chronic diseases.
Full article available to subscribers
Nutrition policies in institutions provide a key opportunity to create healthier food environments that may improve population health and reduce inequities associated with poor nutrition.1 An institutional nutrition policy can create more accessible and affordable healthy food and drinks, thereby positively influencing the dietary intake and preferences of staff and visitors, and ultimately decreasing nutrition-related chronic diseases.2 Population health is the core business of health-related institutions such as hospitals, and so a healthy food and drink policy aligns with the institutional values and expectations of staff and visitors while facilitating a stronger connection between national dietary guidelines and the food environment.1,3 Healthy food and drink policies may also benefit the wider food system if they promote local, sustainable food procurement and food choices that are good for the planet.1 Furthermore, because health-related institutions are large employers, they may be able to influence the types of foods produced for the general community by creating greater demand for and greater supply of healthier products.3
In 2015, The National DHB Food and Drink Environments Network—a group of nutrition, dietetic, food service, and/or public health representatives from all DHBs, along with the Ministry of Health—was established to develop a consistent National Healthy Food and Drink Policy (NHFDP) for voluntary use across all New Zealand district health boards (DHBs) and potentially other public sector settings.4 DHBs are organisations responsible for providing or funding the provision of health services in their district. In developing the NHFDP, The Network received support and advice from the National Heart Foundation, Activity & Nutrition Aotearoa, the Ministry of Health, the Ministry for Primary Industries, the New Zealand Beverage Guidance Panel, and a University of Auckland population nutrition academic (author CNM). The NHFDP was published in 2016 with the intention that DHBs would use it to benchmark their own policies for alignment, and if adopting the policy, they would implement it over a two-year period.4
The NHFDP outlines a set of overarching principles based on the New Zealand Eating and Activity Guidelines for Adults and presents a customised colour-coded food and drink classification system.5 “Green” category foods and drinks are part of a healthy diet. “Amber” category foods and drinks are not considered part of an everyday diet but may have some nutritional value. “Red” category foods and drinks are of poor nutritional value and high in saturated fat, added sugar and/or added salt and energy. The policy encompasses food provided onsite for staff and visitors in cafés, staff cafeterias, catered meetings/functions, fundraisers and vending machines. It also includes food offered offsite if the DHB purchases it. It does not cover patient food or food brought on to the premises by staff or visitors for their own consumption.
DHBs were encouraged to adopt the NHFDP, but individual institutions could continue with their existing policy. An initial review in 2018 found that only five DHBs had adopted or intended to adopt the policy.6 The second edition of the NHFDP was published in September 2019, and includes minor changes to the criteria used to categorise food and drink items in order to make the NHFDP more practical to adopt and implement, although the principles remain the same.7
A recent review of government-led nutrition policies in Australian institutions found that nutrient criteria and guidelines for catering, fundraising and advertising were commonly included in these policies.8 However, an absence of tools and timelines for monitoring and evaluation, and differences in nutrient criteria, were potentially a barrier to the policies’ implementation and intended impact. The review involved policies from state and territory governments, which included hospitals.8 Another review of policies in the United States showed that the policy standards were generally evidence-based, but there were significant barriers and challenges to implementation that should be recognised so regular policy reviews and updates were required.1
In 2020, the Healthier Lives He Oranga Hauora National Science Challenge funded an evaluation of the implementation and impact of the NHFDP, called the HealthY Policy Evaluation (HYPE). As part of the HYPE study, this analysis assesses adoption of the NHFDP by DHBs and central government health institutions, and where the NHFDP was not adopted in full, the alignment between individual institutional healthy food and drink policies and the NHFDP was assessed using a policy content analysis assessment tool adapted for use in the HYPE study.
Method
An approach to quantitatively evaluate food policies was developed by the University of Connecticut (UConn) Rudd Center for Food Policy & Obesity.9 Over time, the Rudd Center’s tools have been adapted to reflect revised regulations and standards in the school and early education sectors.10–13 In New Zealand, versions of the tools have been used to monitor adoption, comprehensiveness and strength of wording of healthy food and drink policies in schools and early learning services.14 In 2018, the International Network for Food and Obesity/Non-communicable Diseases Research, Monitoring and Action Support (INFORMAS) at The University of Auckland developed the first New Zealand DHB food policy assessment tool using the same format and scoring system as the UConn Rudd Center tools.6
The INFORMAS tool assessed healthy food and drink policies across three domains: nutrition standards for a healthy food and beverages environment; promotion of a healthy food and beverages environment; and communication, implementation and evaluation of the policy. Indicators within this earlier tool were adapted for the current HYPE (HealthY Policy Evaluation) study to create the HYPE Policy Assessment Tool. The HYPE Policy Assessment Tool includes 13 indicators on nutritional standards, eight indicators on promotion of a healthy food and drinks environment and five indicators on communication, implementation and evaluation of the policy (detailed in Table 1). Indicators for elements not included in the NHFDP were excluded.
View Table 1.
Each indicator was assigned a “yes” or “no” response regarding inclusion in the institutional policy (forming a measure of the comprehensiveness of topics contained in the policy). A “yes” response was allocated one point, and summed to produce a weighted score out of 10 for each of the three domains. Domain scores were summed to give a total score out of 30 (equal weighting for each domain). The NHFDP was treated as the “gold standard” top score of 30, although some individual institutional policies had clauses exceeding the requirements of the NHFDP, and these were noted in the content analysis. Scores for the “strength of wording” for the indicators (that is, the use of wording that encourages clear interpretation of the policy e.g., “must” and “always” instead of “could” or “when appropriate” (which were part of the INFORMAS and earlier UConn Rudd Centre tools), were not calculated in this study as the NHFDP is not mandatory, making this evaluation component redundant.
Ethical approval to conduct the HYPE study was granted by the Auckland Health Research Ethics Committee (AHREC ref #AH2519), and locality approval was sought from each participating organisation with the assistance of The National DHB Food and Drink Environments Network members.
In early 2021, all 20 New Zealand DHBs and the two central government agencies that had committed to adopting the national policy (Ministry of Health and Health Promotion Agency) were invited via email to provide the latest version of their food and drink policy for the HYPE study. Appropriate organisational contacts were identified via The National DHB Food and Drink Environments Network members. All policies were received within three months. Policies were analysed by Masters of Public Policy students at The University of Auckland as part of their course assessment for POLICY744 (Policy in Practice). Students analysed four policies each and then met in teams of 4–5 to discuss differences in scoring across policies and create a group report which included final scores and recommendations for each of the policies assessed. A policy analysis template (in Microsoft Excel) was provided for recording policy scores for each team, and the complete analysis repeated by one of the authors (BK). Scores across the assessors were checked for consistency, with differences predominately occurring for indicators in Domain 3. Where scores were inconsistent, the final score was discussed and decided by consensus with a second author (SG). Mean total scores (with standard deviation) were produced for each domain and a total score from the sum of domain scores (i.e., three equally-weighted domains). Results for individual organisations have been anonymised in this publication pending provision of that feedback to the DHBs. All analyses were undertaken in Microsoft Excel (see Appendices for full details of scoring).
Results
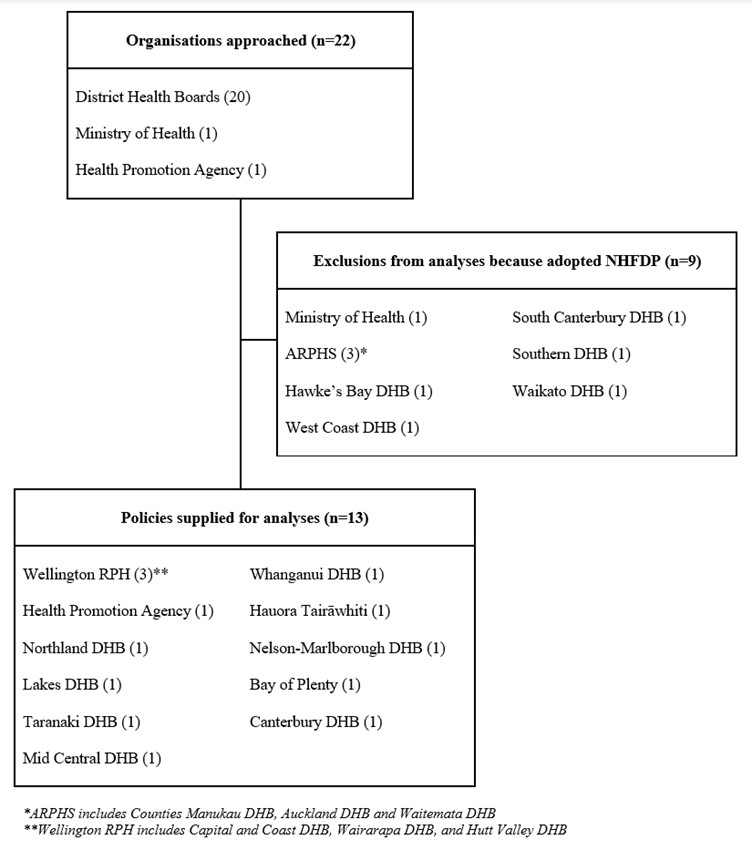
All 22 organisations approached (the 20 DHBs, Ministry of Health, and Health Promotion Agency) responded to our request for information on their policy. There are two regional public health services in New Zealand, and within both, three DHBs follow the same policy. Nine organisations (including the Ministry of Health) reported that they had adopted the NHFDP in full and ,therefore, were not included in the content analysis as the NHFDP was considered the gold standard comparator (Figure 1). Of these nine, two DHBs (South Canterbury and Southern) reported that their institutional policies “go further” than the NHFDP, in that no artificially sweetened beverages or carbonated drinks (including water) were permitted onsite, although written guidance to support this were not provided (and so could not be included in the content analysis). Eleven unique policies were supplied for analysis relating to 13 organisations (Figure 1). Six of the 13 organisations included in the analysis reported they referred to the NHFDP when developing and implementing their policy, and three DHBs were “working toward full adoption of the NHFDP” (Whanganui, MidCentral and Taranaki).
Figure 1: Organisations included and excluded in the HealthY Policy Evaluation (HYPE) Policy Analysis.
The scores for the 11 policies are presented in Table 2, ordered by total score. Policy A scored highest on comprehensiveness by incorporating both verbatim wording from the NHFDP and customised additional wording, including the incorporation of culturally responsive clauses recognising institutional obligations under Te Tiriti o Waitangi (not captured in the assessment scores). Policy K was generic healthy food guidelines, containing points for organisations to consider when developing a nutrition policy, rather than describing what the organisation themselves would do to promote and provide healthy food and drinks.
The scores for the first domain Nutrition standards for a healthy food and beverages environment ranged from 6.9 to 10 and the mean score was 8.7/10. Most institutional DHB policies scored highly on this domain, indicating that they included almost all the same nutrition standard areas as the NHFDP. The NHFDP requires at least 55% of all food and drinks provided onsite to be in the “green” category (low in saturated fat, added sugar and added salt, and mostly whole and less processed), 45% or less of food and drinks in the “amber” category, and no “red” food and drinks be available. Most of the individual institutional policies specified the same criteria, except Policy I from a DHB and Policy K, neither of which specified the proportion of foods provided onsite that should be in each traffic light category.5 Some DHB policies required more than 55% of foods to be in the “green” category: Policy G required 85% of foods to be “green” and 15% “amber”; Policies C and D required 70% of all food to be “green” and the remaining 30% “amber”. Three DHBs specified that water and milk were the only drinks to be provided onsite (policies B, C, H) so 100% of drinks would meet the “green” drink criteria in the NHFDP. Additionally, policies E, G and H did not allow sugar-free versions of soft drinks (any carbonated drinks). However, policy G allowed small-sized (less than 250ml) flavoured milk and no added sugar juices, and policy E allowed fruit and vegetable juices with no added sugar.
Policy E was the only one with specific requirements for vending machines, although this did not go as far as the NHFDP, which says DHBs should move over time to ensure more than 50% of vending machine contents are in the “green” category. Another indicator area where some DHB policies were weak was non-inclusion of specific nutrient criteria for foods or drinks such as limits on the sugar (policies E, F, I) or sodium contents of foods (policies B, I, J, K), as in the NHFDP.
Five of the policies addressed the use of environmentally sustainable and socially responsible practices for purchasing and supply of food and drinks (B, C, F, H, I). Policy C and I focused on reducing food waste by asking people to confirm attendance before an event when catering and eliminating edible food waste, prioritising local food suppliers and producers, and reducing single-use plastic packaging. Reducing consumption of meat and processed meat was specified in Policy C and H, with Policy H providing specific targets for the availability of vegetarian and vegan options, and implementing meat-free Mondays, and fish Fridays.
The scores for the second domain, promotion of a healthy food and beverages environment, ranged from 1.3 to 10, and the mean score was 6.1/10. Five policies (A, C, D, E and J) specified the need for competitive pricing of healthy foods compared to less healthy options. Policies F, G, H, J, and K scored lower on the promotion indicator as the policies did not instruct retailers to ensure healthy food options were prominent and readily available. Policy J also omitted to specify the need to provide facilities for employees for food preparation and breastfeeding. Three policies (G, H, K) did not recommend that drinking water should be accessible onsite. Policies C, E, and K did not include wording about restrictions on partnerships, fundraisers, and promotions involving products and brands inconsistent with a healthy food and beverage environment.
The third domain, communication, implementation and evaluation of the policy, produced the lowest scores, ranging from zero to eight, and with a mean score of 3.8/10. Policies A, B, C, and H were the only ones to explicitly state that contracts for food provision should contain a healthy food and drink contract clause. Eight of the 11 policies specified a staff member responsible for ensuring that contracted food providers aligned their food provision with the adopted policy. Less than half of the 11 policies specified how the policy would be evaluated, or when the policy would be reviewed.
The four highest-scoring policies in 2021 scored between 20 and 27 (out of 30), while three policies scored between 10 and 15 (out of 30). Table 3 summarises areas where policies were strongest (at least 90% = ≥10 of the 11 policies met the criteria) and weakest (less than 50% = ≤5 of the 11 policies met the criteria).
View Tables 2 & 3.
Discussion
In 2021, more than half of New Zealand’s 20 DHBs had either already adopted (n=9) or intended to adopt (n=3) the NHFDP, whilst some that had not adopted the NHFDP as their institutional policy contained guidelines that went beyond the NHFDP. This shows an increase in the adoption of the NHFDP over time, as five years ago only five DHBs had adopted the NHFDP.6 Most individual institutional policies were not as comprehensive as the NHFDP. The 2018 study of DHB food policies also found that individual DHB policies were not as comprehensive as the NHFDP across all three domains.6 However, in 2021, some DHB policies contained stricter or additional clauses (not noted in 2018) which could be considered for inclusion in future iterations of the NHFDP.
The content analysis of 11 institutional policies from 13 organisations that had not yet adopted the NHFDP found considerable variation in the comprehensiveness of their nutrition standard areas relative to the NHFDP. Previous research has found that retailers and suppliers working across multiple institutions have difficulty implementing different healthy food and drink policies when there is inconsistency in the standards and expectations, and particularly when there are limits on specific nutrients, such as sodium, that need to be remembered.15–17 Differences in institutional healthy food policies can create and/or exacerbate regional population health and nutrition inequities, and make it difficult and confusing for food suppliers and retailers that work across several DHBs.
Indicators from the third domain, communication, implementation and evaluation, were frequently missing from the individual institution policies. The NHFDP is, itself, not strong in this area, simply stating: “monitoring and evaluating the policy will be part of each organisation’s Implementation Plan and will be aligned to the agreed expectations of The Network and the Ministry of Health.” Consequently, it is probable that this aspect is weak across the sector, including within those organisations that have adopted the NHFDP.7 Yet, existing literature about communication and monitoring of healthy food and drink policies show that it is critical to create accountability and enable feedback to senior leadership, and assists with justifying any necessary changes to the food environment.1,18–21 Future iterations of the NHFDP should add more about how the policy will be made available, monitored and evaluated, and who is in charge of implementation.
Some clauses found in some individual DHB policies arguably improve on standards in the existing version of the NHFDP, showing such improvements may be feasible for inclusion in future iterations of the NHFDP:
• The importance and obligation of the organisation to provide a healthy food and beverage environment under Te Tiriti o Waitangi;
• Specification of a higher proportion of “green” items overall (NHFDP specifies a minimum of 55%, but some institutional policies have set thresholds at 70% and 85%);
• Definition of all processed meats as “red” items, i.e., not permitted;
• Definition of all carbonated drinks (including water) defined “red”, a standard currently adopted by six DHBs;
• Use of specific sustainable and socially responsible practices for purchasing and supplying food and drinks, e.g., meat-free Mondays, fish Fridays, no single-use plastics (straws, cutlery, takeaway containers), and choosing seasonal and local food producers;
• Elimination of edible food waste and processing inedible food waste in an environmentally responsible way.
Additionally, the effectiveness of NHFDP would be strengthened if it were made mandatory, whereby compliance with the policy becomes a standard and required part of organisational operations rather than voluntary recommendations as currently.1 Mandatory regulations are well documented in the public health literature to be more effective than voluntary codes and guidelines.22,23 Australian and Canadian studies have found the inclusion of the policy in procurement contracts between the organisation and retailers, caterers and other food suppliers meant there was “no real room for arguments” and ensured compliance.24–26 The original UConn Rudd Center policy assessment tools include the indicator: “specifies a course of action when the healthy food policy is breached”, which would be relevant to include in future policy analyses if the NHFDP was made mandatory, but was not included in the current tool as voluntary policies cannot be enforced.1,13 Also, the tool included the indicator: “addresses how to deal with suggestions, concerns and complaints regarding the healthiness of food environment on the DHB premises”, but this was not included in the current assessment because this criteria was not included in the NHFDP.
The present study found an increase since 2018 in the adoption of the NHFDP, and found improvements in the content of other individual institutional policies regarding the food and drinks environments for staff and visitors in Aotearoa New Zealand’s hospitals. However, there is inconsistency between policies, and this potentially confuses and frustrates retailers/suppliers who work across multiple institutions. Such inconsistencies also limit the opportunity to provide equitable access for all to nutritious foods and beverages, which would improve long-term population health outcomes while simultaneously benefitting the wider food system. Evaluation of the nutrient profile of foods currently available in New Zealand DHBs to assess the degree of implementation and impact of healthy food and beverage policies is currently underway. This will be critical for identifying how the differing policies found in the present study impact on the actual food available to staff and visitors in hospital settings throughout Aotearoa.
Aim
To assess adoption of the voluntary National Healthy Food and Drink Policy (NHFDP) and the alignment of individual institutional healthy food and drink policies with the NHFDP.
Methods
All 20 district health boards (DHBs) and two national government agencies participated. Policies of those organisations that had not fully adopted the NHFDP were assessed across three domains: nutrition standards; promotion of a healthy food and beverages environment; and policy communication, implementation and evaluation. Three weighted domain scores out of 10, and a total score out of 30 were calculated.
Results
Nine of the 22 organisations reported adopting the NHFDP in full. Of the remaining 13, six referred to the NHFDP when developing their institutional policy and three were working toward full adoption of the NHFDP. Mean scores (SD) were 8.7 (1.0), 6.1 (2.6) and 3.8 (2.2) for the three domains, and 18.6 (4.8) in total. Most individual institutional policies were not as comprehensive as the NHFDP. However, some contained stricter/additional clauses that would be useful to incorporate into the NHFDP.
Conclusion
Since a similar policy analysis in 2018, most DHBs have adopted the NHFDP and/or strengthened their own nutrition policies. Regional inconsistency remains and a uniform mandatory NHFDP should be implemented that incorporates improvements identified in individual institutional policies.
Authors
Sarah Gerritsen PhD: Senior Research Fellow, Social and Community Health, School of Population Health, The University of Auckland, Auckland, New Zealand. Bruce Kidd: Project Support Assistant, National Institute for Health Innovation, The University of Auckland, Auckland, New Zealand. Magda Rosin: PhD Candidate, School of Population Health, The University of Auckland, Auckland, New Zealand. Stephanie Shen: Project Support Assistant, National Institute for Health Innovation, The University of Auckland, Auckland, New Zealand. Sally Mackay: PhD, Senior Lecturer, Epidemiology and Biostatistics, School of Population Health, The University of Auckland, Auckland, New Zealand. Lisa Te Morenga PhD: Associate Professor, Research Centre for Hauora and Health, Massey University, Wellington, New Zealand. Cliona Ni Mhurchu PhD: Professor of Population Nutrition, National Institute for Health Innovation, The University of Auckland, New Zealand; Honorary Professorial Fellow, The George Institute for Global Health, Australia.Acknowledgements
acknowledgements This study was funded by the National Science Challenge Healthier Lives He Oranga Hauora as part of the HYPE (Healthy Policy Evaluation) study, evaluating the implementation and impact of the National Healthy Food and Drink Policy (PI: Cliona Ni Mhurchu). Thank you to the other members of the HYPE team, Elaine Umali and Yannan Jiang.Correspondence
Dr Sarah Gerritsen: Senior Research Fellow, Social and Community Health, School of Population Health, University of Auckland, Private Bag 92019, Auckland 1142, Ph.: 09 923 4262Correspondence email
s.gerritsen@auckland.ac.nzCompeting interests
Four authors (Cliona Ni Mhurchu, Magda Rosin, Stephanie Shen and Bruce Kidd) are members of The National DHB Food and Drink Environments Network. The Network had no role in the study design, data collection and analysis, decision to publish, or preparation of the manuscript. All other authors declare they have no conflict of interests.1) Gardner CD, Whitsel LP, Thorndike AN, et al. Food-and-beverage environment and procurement policies for healthier work environments. Nutr Rev. 2014;72(6):390-410. doi:10.1111/nure.12116.
2) Matwiejczyk L, Mehta K, Scott J. Engaging South Australian local governments in the development of healthy eating policies. Health Promot J Austr. 2017;28(2):148-150. doi:10.1071/HE15109.
3) Dojeiji L, Taylor A, Boland C, Brennan C, Penney R. Retail food reform: How to effectively bridge what we say and what we do in our hospital settings. Healthc Manag Forum. 2017;30(2):101-106. doi:10.1177/0840470416674963.
4) National District Health Board Food and Drink Environments Network. National Healthy Food and Drink Policy.; 2016.
5) Ministry of Health. Eating and Activity Guidelines for New Zealand Adults.; 2015.
6) Vandevijvere S, Mackay S, D’Souza E, Swinburn B. How Healthy Are New Zealand Food Environments? A Comprehensive Assessment 2014-2017. The University of Auckland, Auckland, New Zealand; 2018.
7) National District Health Board Food and Drink Environments Network. National Healthy Food and Drink Policy (2nd Ed).; 2019. https://www.health.govt.nz/publication/national-healthy-food-and-drink-policy.
8) Rosewarne E, Hoek AC, Sacks G, et al. A comprehensive overview and qualitative analysis of government-led nutrition policies in Australian institutions. BMC Public Health. 2020;20(1):1-15. doi:10.1186/s12889-020-09160-z.
9) University of Connecticut. UConn Rudd Center for Food Policy and Health.
10) Koriakin TA, McKee SL, Schwartz MB, Chafouleas SM. Development of a Comprehensive Tool for School Health Policy Evaluation: The WellSAT WSCC. J Sch Health. 2020;90(12):923-939. doi:10.1111/josh.12956.
11) Schwartz MB, Piekarz-Porter E, Read MA, Chriqui JF. Wellness school assessment tool version 3.0: An updated quantitative measure of written school wellness policies. Prev Chronic Dis. 2020;17. doi:10.5888/PCD17.190373.
12) Schwartz MB, Henderson KE, Falbe J, et al. Strength and Comprehensiveness of District School Wellness Policies Predict Policy Implementation at the School Level*.; 2012. http://www.ashaweb.org/continuing_education.html.
13) Falbe J, Kenney EL, Henderson KE, Schwartz MB. The Wellness Child Care Assessment Tool: A Measure to Assess the Quality of Written Nutrition and Physical Activity Policies. J Am Diet Assoc. 2011;111(12):1852-1860. doi:10.1016/j.jada.2011.09.006.
14) Gerritsen S, Wall C, Morton S. Child-care nutrition environments: Results from a survey of policy and practice in New Zealand early childhood education services. Public Health Nutr. 2016;19(9):1531-1542. doi:10.1017/S1368980015002955.
15) Green S, Glanz K, Bromberg J. Facilitators and Barriers to Developing, Implementing, and Evaluating Healthy Vending Policies in Four Cities. Health Promot Pract. 2021;22(5):670-675. doi:10.1177/1524839919900493.
16) Shipton D, NHS Health Scotland. Evaluation of the Implementation and Impact of the Healthcare Retail Standard in Scottish Hospitals and Other NHS Facilities in 2017.; 2019.
17) Washington State. Implementation of Washington State’s Healthy Nutrition Guidelines Under Executive Order 13-06: Mid-Term Evaluation; 2016.
18) Brooks CJ, Barrett J, Daly J, et al. A community-level sodium reduction intervention, Boston, 2013–2015. Am J Public Health. 2017;107(12):1951-1957. doi:10.2105/AJPH.2017.304070.
19) Atkey K, Elliott-Moyer P, Freimanis M, Raine KD. Stories of policy change: City of Hamilton’s healthy food and beverage policy. Can J Public Heal. 2017;108(5-6):e625-e629. doi:10.17269/cjph.108.6074.
20) Law KK, Pulker CE, Healy JD, Pollard CM. “Just So You Know, It Has Been Hard”: Food Retailers’ Perspectives of Implementing a Food and Nutrition Policy in Public Healthcare Settings. Nutrients. 2021;13(6). doi:10.3390/nu13062053.
21) Hawkes C, Jewell J, Allen K. A food policy package for healthy diets and the prevention of obesity and diet-related non-communicable diseases: The NOURISHING framework. Obes Rev. 2013;14(S2):159-168. doi:10.1111/obr.12098.
22) Miller J, Lee A, Obersky N, Edwards R. Implementation of A Better Choice Healthy Food and Drink Supply Strategy for staff and visitors in government-owned health facilities in Queensland, Australia. Public Health Nutr. 2015;18(9):1602-1609. doi:10.1017/S1368980013003455.
23) Galbraith-Emami S, Lobstein T. The impact of initiatives to limit the advertising of food and beverage products to children: A systematic review. Obes Rev. 2013;14(12):960-974. doi:10.1111/obr.12060.
24) Boelsen-Robinson T, Backholer K, Corben K, Blake MR, Palermo C, Peeters A. The effect of a change to healthy vending in a major Australian health service on sales of healthy and unhealthy food and beverages. Appetite. 2017;114:73-81. doi:10.1016/j.appet.2017.03.026.
25) Riesenberg D, Blake MR, Boelsen-Robinson T, Peeters A, Cameron AJ. Policies influencing the provision of healthy food and drinks in local government-owned sport and recreation facilities in Victoria, Australia. Aust N Z J Public Health. 2020;44(3):240-244. doi:10.1111/1753-6405.12988.
26) Naylor PJ, Olstad DL, Therrien S. An intervention to enhance the food environment in public recreation and sport settings: A Natural experiment in British Columbia, Canada. Child Obes. 2015;11(4):364-374. doi:10.1089/chi.2014.0148.
