ARTICLE
Vol. 133 No. 1510 |
The prevalence of microvascular complications in Waikato children and youth with type 1 diabetes has reduced since 2003
It is well known that good glycaemic control in type 1 diabetes (T1D) prevents, delays and slows the progression of microvascular complications such as diabetic retinopathy and nephropathy.
Full article available to subscribers
It is well known that good glycaemic control in type 1 diabetes (T1D) prevents, delays and slows the progression of microvascular complications such as diabetic retinopathy and nephropathy.1 Conversely, poor glycaemic control in T1D, as reflected by high mean haemoglobin A1c (HbA1C), is associated with a greater risk of these complications and death from any cause.2 Accordingly, international guidelines recommend a target HbA1c of less than 53mmol/mol (7%) for children and youth with T1D.3,4 To further prevent microvascular and macrovascular complications in T1D, International Society for Pediatric and Adolescent Diabetes (ISPAD) guidelines recommend pharmacological treatment of hypertension and low-density lipoprotein concentrations (LDLc) >3.4mmol/L.3 However, despite these recommendations, most young people with T1D, particularly youth, ethnic minorities and those more socioeconomically deprived, do not meet these glycaemic targets.3,5,6
Recent technological advances such as insulin pump therapy (continuous subcutaneous insulin infusion; CSII), flexible insulin regimens, longer-acting insulin analogues and flash and continuous glucose monitoring (FGM and CGM), have been associated with improved glycaemic control7,8 and reduced prevalence of microvascular complications in patients with T1D,9,10 but not in all populations.11 Consequently, the temporal changes in glycaemic control and the prevalence of microvascular complications in young people with T1D outside of Europe and the US are not clear, particularly in New Zealand.
Youth with T1D in the Waikato are cared for by two diabetes services, the Waikato Paediatric Diabetes Service (patients <15 years of age) and the Youth and Young Adult Diabetes Service (patients 15–24 years of age). Compared with similarly aged unselected cohorts worldwide, children and youth with T1D in the Waikato region in 2003 were shown to have comparable glycaemic control and burden of microvascular disease with a mean HbAc of 77mmol/mol (9.2%), and prevalence of diabetic retinopathy and nephropathy of 26.4% and 25.4%, respectively.12
Given the recent technological advances in managing T1D and the lack of data on temporal changes in outcomes in youth with T1D, the aim of this study was to determine whether glycaemic control and rates of microvascular disease have improved in children and youth with T1D in the Waikato region since 2003.
Methods
A retrospective review of clinical records was carried out for all children (0–15 years; n=111) and youth (16–24 years; n=144) with T1D under the care of the Waikato Paediatric Diabetes and Youth and Young Adult Diabetes Services from 1 March 2016 to 28 February 2017 (the ‘2017’ cohort). This data was compared to published data from 2003 (n=251), which reports on patients with T1D born after 1 Jan 1978 who had attended the Waikato Diabetes Unit.12 This earlier dataset was available as published data only, and the authors of the current study had no access to the raw data.
The diagnosis of T1D in all patients in both the 2003 and 2017 cohorts was based on diagnostic hyperglycaemia with positive anti-GAD or anti-IA2 antibodies and/or ketonuria, ketoacidosis or severe insulin deficiency at presentation. Variables including demographic data, duration of diabetes, insulin regimen (CSII versus multiple dose injections (MDI)), smoking status, HbA1c, co-diagnosis of coeliac disease, body mass index (BMI) and blood pressure (BP) at their first clinic appointment in the study period were recorded. Socioeconomic status was determined using the New Zealand deprivation score,13 and urban-rural profiling was performed using the New Zealand Department of Statistics database.14 HbA1c results from patients in the 2017 cohort who had been diagnosed with T1D within the last six months were excluded from analysis (n=19), except for comparison of patient characteristics between the 2003 and 2017 cohorts (Table 1). HbA1c targets were as per ISPAD3 and American Diabetes Association (ADA) guidelines15 at the time of the study, with <58mmol/mol (<7.5%) for patients <17 years of age, and <53mmol/mol (<7.0%) for patients >18 years of age. HbA1c was measured in the laboratory in 2003 and in the laboratory or point of care device in 2017, all of which were aligned to DCCT methodology. All diagnoses of coeliac disease were confirmed by duodenal biopsy. For children, overweight and obese were defined as BMI >85th centile and BMI >95th centile, respectively, using the National Center for Chronic Disease Prevention growth charts.16 For youth, overweight and obese were defined as BMI >25kg/m2 and BMI >30 kg/m2, respectively. All blood pressures were measured manually and hypertension was defined as a systolic BP >130mmHg and/or diastolic BP >80mmHg in youth, and a systolic BP >120mmHg and/or diastolic BP >70mmHg in children. LDLc were typically obtained from non-fasting laboratory results within the study period and as per ADA guidelines, dyslipidaemia was defined as an LDLc >2.6mmol/L in patients >10 years of age.15 Patients were deemed to smoke if they had any chronic tobacco intake during the study period, though the smoking status was not available for 12 patients. During the study all children attended at least one clinic appointment, while 28 youth (19%) did not attend any clinic appointments. The data for patients who did not attend a clinic was obtained from primary care records, and from our diabetes retinal photoscreening database. Body weight measurements were not available for three patients, and a further three patients had had no coeliac serology performed.
Table 1: Patient characteristics of the 2003(12) and 2017 study cohorts.
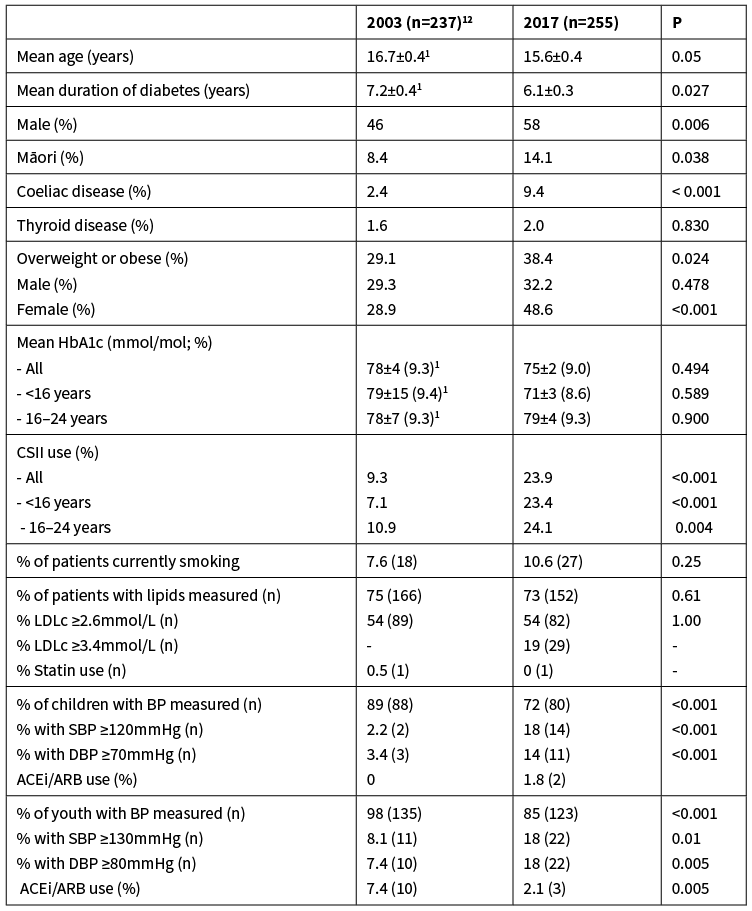
SBP = Systolic Blood Pressure; DBP = Diastolic Blood Pressure; ACEi = Ace Inhibitor; ARB = Angiotensin II receptor blockers.Continuous variables are presented as mean ± SEM. 1 S.E.M was calculated from the original 2003 publication12 using SD = (confidence interval / 3.92) * )
For assessment of microvascular complications, analyses were restricted to patients that had had T1D for >10 years. As elsewhere in New Zealand, Waikato patients with T1D have a routine urinary albumin:creatinine ratio (UACR) performed annually and retinal photoscreening at least every two years. Persistent microalbuminuria was defined as a UACR >2.5mg/mmol in males and >3.5mg/mmol in females on at least two out of three consecutive collections. All patients with an elevated UACR typically had a repeat UACR repeated within three months. Albuminuria was defined as a UACR >30mg/mmol. Ophthalmologists report retinal photoscreening as no retinopathy, non-proliferative retinopathy or proliferative retinopathy. Only one patient had no recent retinal photoscreening, and this patient and one other patient did not have a recent UACR. The methods and frequency of complication screening did not differ between the 2003 and 2017 cohorts. All hospital admissions for each patient within the study period were also recorded. Diabetic ketoacidosis (DKA) was defined as a metabolic acidosis with ketonaemia. Non-DKA diabetes-related admissions included non-acidotic ketonaemia, hyperglycaemia, hypoglycaemia and sepsis. Ethical approval was sought, but not required, as this was classified as an audit.
Statistical analyses
Data are presented as mean ± standard error of the mean (SEM). Statistical analyses were performed using two-tailed Student t-tests or Mann-Whitney U tests for parametric and non-parametric continuous variables, respectively, and Pearson’s Chi-square tests for binary variables. Spearman’s correlations were used to determine if there was a relationship between HbA1c and either length of disease or socioeconomic status. Comparisons were also made between the 2017 cohort and the 2003 Waikato cohort.12 These comparisons are limited to the published data only, because the raw data from 2003 is not available. However, differences between means (eg, HbA1c values) for the two data sets were calculated using GraphPad Software that required only mean, SEM and n values (Graph Pad, San Diego, US). Significance was defined as a P value <0.05.
Results
Description and glycaemic control of the study cohorts
Demographic and clinical characteristics from both the 2017 (n=255) and 2003 (n=237) cohorts are displayed in Table 1. Patients in the 2003 cohort were slightly older, with a slightly longer duration of diabetes (Table 1). Patients in the 2017 cohort were more likely to be male (58% vs 46%; χ2=7.59; P=0.006) and have coeliac disease (9.4% vs 2.4%; χ2=11.84; P<0.001) than those in 2003. Patients in the 2017 cohort were also more likely to be overweight or obese, but this was due to increased obesity of females only (48.6% vs 28.9%; χ2=21.59; P<0.0001; Table 1). No patients in either cohort were pregnant. There was a similar increase in the use of CSII between 2003 and 2017 in both children (16.3%; χ2=10.45; P=0.001) and youth (13.2% χ2=8.42; P=0.004). The mean HbA1c was lower in children only, but this did not reach statistical significance (Table 1). Only 14% of patients ≤17 years of age and 10.3% of patients >18 years of age in the 2017 cohort met the recommended age-specific targets of an HbA1c <58mmol/mol and <53mmol/mol, respectively.
Glycaemic control in the 2017 cohort
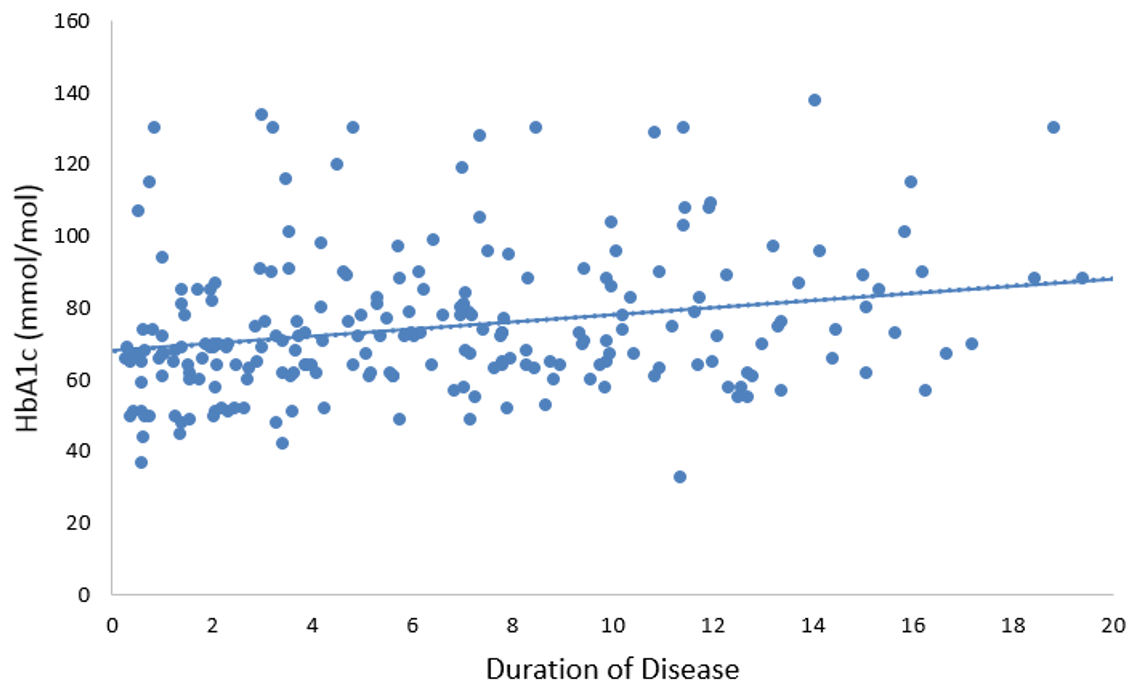
There were no differences in the mean HbA1c in the 2017 cohort between genders (P=0.44), between those that live in urban areas and those that live rurally (P=0.10) or between those that have or don’t have coeliac disease (P=0.95; Figure 1). In contrast, those on CSII had a lower HbA1c than those on multiple daily injections of insulin (MDI; P=0.01). Youth and Māori had a higher HbA1c than children and non-Māori (both P=<0.001), respectively. Mean HbA1c was positively correlated with worsening socioeconomic deprivation (rs=0.263, P<0.001), and positively correlated with duration of diabetes (Figure 2; rs=0.182; P=0.006).
Figure 1: Differences (mean ± SEM) in HbA1c (mmol/mol) levels between demographic groups (n=236). HbA1c values for patients diagnosed less than six months ago (n=19) were excluded. Asterisks denote significant differences between groups (**P=0.01; ***P<0.001).
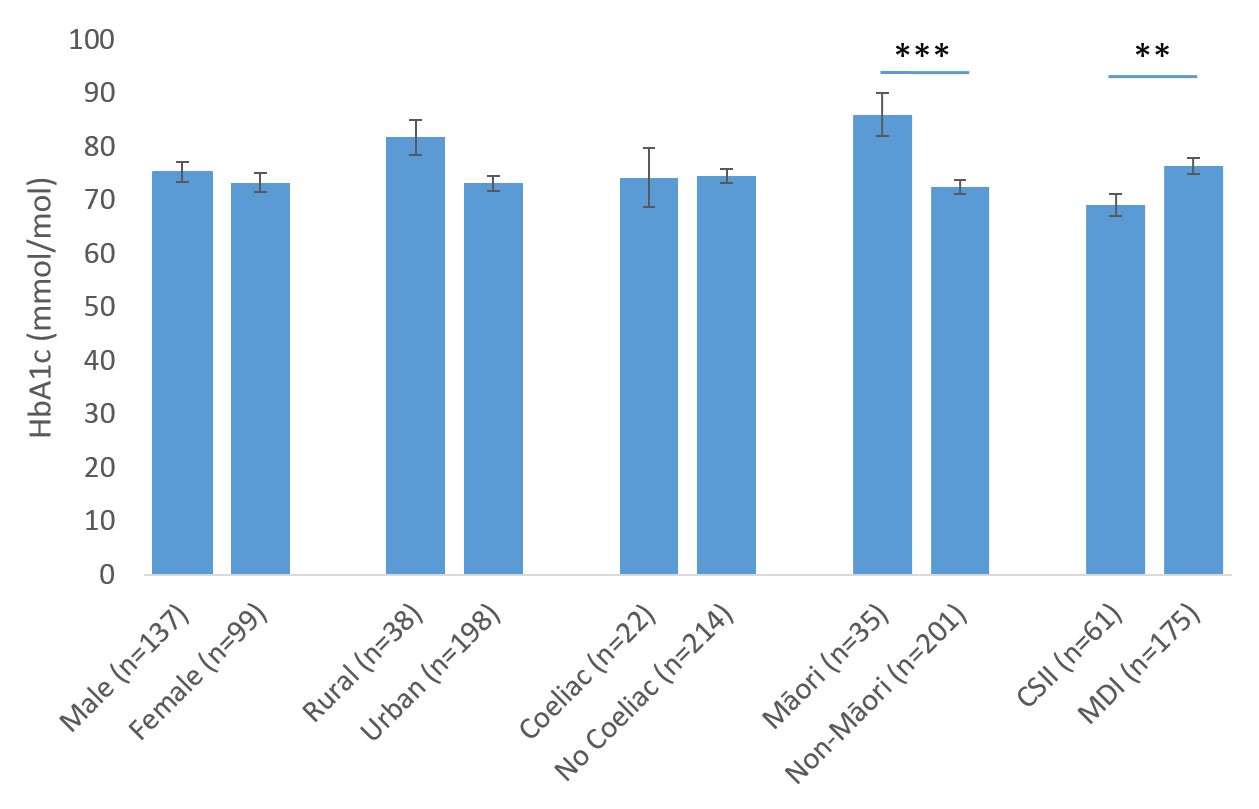
Figure 2: Relationship between mean HbA1c and duration of disease (years since diagnosis) (n=236). HbA1c values for patients diagnosed less than six months ago were excluded from this analysis.
Microvascular complications and hospital admissions
The analysis of microvascular complications in the 2003 cohort were restricted to those with a duration of diabetes of >10 years (n=67),12 so the same restrictions were applied to the 2017 cohort for comparison (n=67). The prevalence of both diabetic retinopathy and nephropathy was significantly lower in the 2017 cohort than in the 2003 cohort, including no patients with vision-threatening retinopathy or overt proteinuria (Table 2). Symptomatic diabetic neuropathy remains rare. The decrease in microvascular complications occurred despite no significant change in the rates of smoking or dyslipidaemia, and at least a two-fold increase in systolic and/or diastolic hypertension in both children and youth (Table 1). Only 11 youth and no children had either a systolic blood pressure >140mmHg or diastolic blood pressure >90mmHg. However, at least 15% of children and youth in the 2017 cohort had no documented assessment of blood pressure at their clinic appointments, which is an increase from 2003. Approximately one quarter of patients >10 years of age did not have their lipid studies performed in either cohort (Table 1). In those patients who were assessed, despite over half having dyslipidaemia and approximately one-quarter having systolic and/or diastolic hypertension, the use of lipid-lowering therapy and ACE inhibitors (ACEi) or angiotensin II receptor blockers (ARBs) remains low. Two of the four patients with persistent microalbuminuria were treated with ACEi/ARBs. No patients were on alternative antihypertensive treatment to ACEi/ARBs. Only one of the 29 patients in the 2017 cohort with a known LDLc >3.4mmol/L were treated with statin therapy.
Table 2: Prevalence of microvascular complications in patients with T1D for more than 10 years.
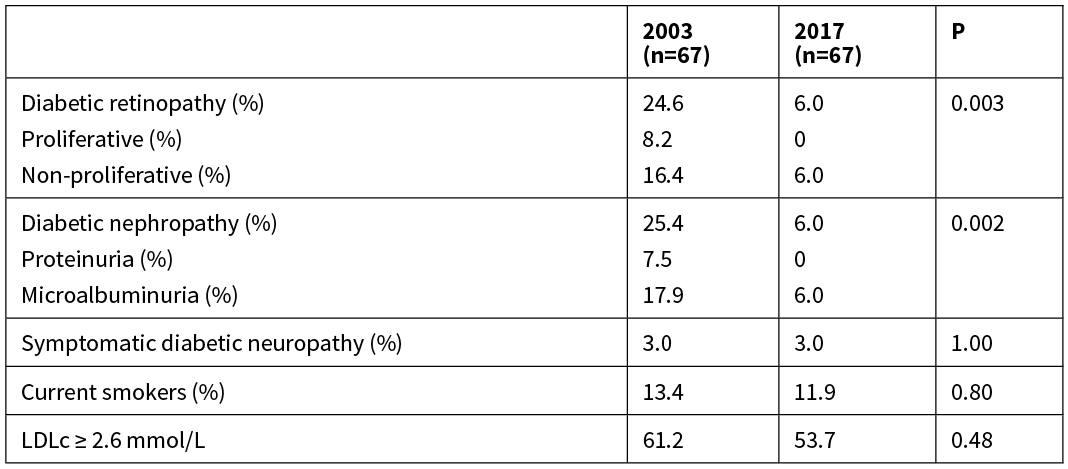
LDLc = Low Density Lipoprotein cholesterol.
Twenty patients (7.8%) in the 2017 cohort were admitted with DKA during the study period. A further 27 patients (10.6%) had a diabetes-related admission other than DKA in the study period. This equated to 1.2 inpatient days per patient year, compared with 1.6 inpatient days per patient year in 2003. Youth were more likely than children to have a diabetes-related admission (23.6% versus 13.5%; P=0.04), primarily due to a greater proportion being admitted with DKA (12.5% versus 1.8%; P=0.002). Approximately 35% of patients admitted with DKA were readmitted at least once more with DKA within the study period.
Discussion
Despite the availability of longer acting insulin analogues, an almost three-fold increase in CSII use and their ability to improve glycaemic control,17 it is disappointing that the mean HbA1c in Waikato youth with T1D has not changed over the past 14 years. Furthermore, less than one in six children and youth in the 2017 cohort were meeting their recommended glycaemic targets. Although we and others have shown that this stage of life continues to be the most difficult to obtain tight glycaemic control,18,19 results appear more promising in other centres. Indeed, the mean HbA1c is lower (between 65 to 68mmol/mol) with at least two-fold greater rates of achieving the same glycaemic targets in similarly aged cohorts in other Australasian20 and in European centres.21,22 However, the median HbA1c of 74mmol/mol in our youth is comparable to other international centres.9,18,19 Moreover, despite a marked increase in both CSII and CGM use in youth in the T1D exchange in the US, glycaemic control has deteriorated in this population over the past decade.19
As seen both nationally and worldwide, patients from more socially deprived populations and ethnic minorities (Māori) in our study had a higher HbA1c than their peers.6,23,24 But in contrast to these international studies, it is not clear why patients living in rural areas in our 2017 cohort did not have poorer glycaemic control than their urban counterparts. It is also not clear, why in contrast to other cohorts, that gender had no effect on glycaemic control in our study.9,18,19 Nevertheless, with the lack of change and persistence of poor glycaemic control in Waikato youth, it is surprising that there was a marked decrease in the prevalence of diabetic retinopathy and neuropathy in those with T1D for more than 10 years. The reasons for this decrease, particularly the absence of both proliferative retinopathy and overt proteinuria, are not known, given there was an increase in obesity and mild hypertension, and no decrease in other vascular risk factors such as smoking and dyslipidaemia. Furthermore, it is also not clear why the prevalence of diabetic retinopathy and nephropathy in Waikato youth appears to be lower than in European and American youth with T1D.5,9,25,26 Potential explanations for the lower complication burden in the 2017 cohort include the small sample size, and the limitation that assessment between only two time points may not detect any significant improvements in glycaemic control associated with the benefits of ‘metabolic memory’.1 However, it would be useful if future studies evaluated the cause of some of these observations. Nevertheless, others have also shown a marked decline in the incidence of diabetic retinopathy and nephropathy without significant temporal improvements in HbA1c levels.27,28 Therefore, other factors that were not investigated in this study, such as glycaemic variability and time within normoglycaemia are likely important.29,30 The latter is difficult to know because CGM and FGM are not funded in New Zealand, FGM only became available in late 2017, and patients can purchase directly from the vendor without notifying their diabetes team. However, we estimate that CGM or FGM was used by less than 10% of patients in the 2017 cohort and no patients in the 2003 cohort when their parameters were measured.
A further possibility for the reduction in complication burden is the addition of a clinical psychologist and dietitian who joined the endocrinologists and diabetes nurse specialists in the Waikato Paediatric and Youth and Young Adult teams from 2006. It is widely recognised that both a psychologist and dietitian are key members of the multidisciplinary team in improving glycaemic control by addressing the high prevalence of psychosocial stressors and disordered eating in these age groups.4
However, the definitive reasons for the temporal decrease in microvascular complications in this study are not known, as the raw data from the 2003 cohort was not available. In particular, the glycaemic control, gender, duration of diabetes, clinic attendances, ethnicity and blood pressures were not reported specifically for those in the 2003 cohort in which the analyses for microvascular complications were performed. Inferring this data from the total cohort data may result in bias, which is relevant given that the 2017 cohort were on the whole younger, had a shorter duration of diabetes and were more likely to be male, with the latter associated with increased microalbuminuria.31 But of note, in addition to no differences in smoking or dyslipidaemia, the 2017 cohort who had had T1D for more than 10 years were likely to be more obese, hypertensive and/or Māori than their peers in 2003, all of which independently increase the risk of diabetic complications.24 Another limitation of this study are that for consistency, arbitrary rather than centile cut offs were used to define hypertension, that may underestimate hypertension in children and overestimate hypertension in youth.
The increase in obesity from 2003 in our study may just reflect the increase in childhood obesity in the general New Zealand population;32 but children and youth with T1D are now more obese than their peers in other Australasian centres and internationally.20,33,34 It is not clear why this increase only occurred in females, or whether any supraphysiological dosing of insulin or increased carbohydrate intake to avoid or treat hypoglycaemia is responsible. Nevertheless, prevention and management of excess weight gain is important because obesity appears to be an independent risk factor for diabetic microvascular and macrovascular complications, and other comorbidities, including reduced quality of life.35
Although the rates of DKA in our cohort are similar to those seen internationally, it is concerning that one in every 13 of our youth with T1D are admitted with DKA each year, given the associated adverse neurocognitive outcomes.36,37 It is also concerning that despite the increase in the prevalence in hypertension and dyslipidaemia in our study, the percentage of patients prescribed antihypertensive and lipid-lowering therapy has decreased. Moreover, only half of youth with persistent microalbuminuria were treated with ACEi/ARBs. Similarly low rates of ACEi/ARB use in this age group have been reported in other cohorts internationally, which is thought largely due to clinical inertia from committing youth to lifelong treatment.9,28 Although the low rates of screening and treatment of hypertension and dyslipidaemia in our study are explained in part by non-attendance at clinic appointments, work is required to improve screening for these risk factors in primary and secondary care given that there is likely contact when the youth receives their prescription for insulin. Further work is also needed to reduce the clinical inertia in treating vascular risk factors in youth with T1D, particularly given that lipid-lowering therapy and ACEi/ARBs are safe and effective treatments in adolescence and greatly reduce the microvascular and macrovascular disease burden in adulthood.38
In conclusion, despite a pleasing local decrease in the prevalence of microvascular complications, our study suggests that teams caring for youth with T1D need to continue to focus on identifying and addressing the barriers to improved glycaemic control and reduction of modifiable vascular risk factors. These interventions should also be focused on reducing the inequity in outcomes between Māori and non-Māori youth with T1D.
Aim
To determine whether glycaemic control and the prevalence of microvascular complications in Waikato children/youth with type 1 diabetes (T1D) has changed since 2003.
Methods
A retrospective review was performed of clinical records of children and youth with T1D who were under the care of the Waikato Paediatric and Young Adult Diabetes Services between March 2016 and March 2017. Comparisons were made to published data from the same service in 2003.
Results
Despite a more than two-fold increase in insulin-pump therapy since 2003, glycaemic control was not significantly improved in either children or youth. However, since 2003 there has been a significant reduction in the prevalence of diabetic retinopathy (24.6% vs 6.0%; P=0.003) and nephropathy (6.0% vs 25.4%; P=0.002), while symptomatic diabetic neuropathy remains rare. This reduction occurred despite a significant increase in obesity and hypertension, and no significant difference in the rates of dyslipidaemia or smoking.
Conclusion
There has been a marked reduction in microvascular complications in Waikato youth and young adults with type 1 diabetes, but the reasons for the reduction are not clear given there has been no significant improvements in glycaemic control.
Authors
Sukhbir K Sandhu, Paediatric Registrar, Waikato District Health Board, Hamilton; Vickie M Corbett, Nurse Practitioner, Waikato District Health Board, Hamilton; Lynne Chepulis, Senior Research Fellow, Medical Research Centre, University of Waikato, Hamilton; John Goldsmith, Paediatrician, Waikato District Health Board, Hamilton; Priya Joseph, Diabetes Nurse Specialist, Waikato District Health Board, Hamilton; Sonya K Fraser, Dietitian, Waikato District Health Board, Hamilton; Joanna M McClintock, Clinical Psychologist, Waikato District Health Board, Hamilton; Ryan G Paul, Endocrinologist, Waikato Health Board, Hamilton.Acknowledgements
We thank Peter Dunn, Susie Ryan (previously Whitcombe) and David Bouchier for allowing us to use the 2003 data.Correspondence
Dr Ryan Paul, Waikato Regional Diabetes Service, 26 Clarence Street, Private Bag 3200, Hamilton 3240.Correspondence email
ryan.paul@waikatodhb.health.nzCompeting interests
Nil.1. Nathan DM, Bayless M, Cleary P, et al. Diabetes control and complications trial/epidemiology of diabetes interventions and complications study at 30 years: advances and contributions. Diabetes. 2013; 62(12):3976–86.
2. Lind M, Svensson A-M, Kosiborod M, et al. Glycemic control and excess mortality in type 1 diabetes. New Engl J Med. 2014; 371(21):1972–82.
3. International Society for Pediatric and Adolescent Diabetes (ISPAD). ISPAD Clinical Practice Consensus Guidelines. Available at http://www.ispad.org/?page=ISPADClinicalPract [accessed April 02, 2019]. 2018.
4. National Institute for Health and Care Excellance. Diabetes (type 1 and type 2) in children and young people: diagnosis and management: NICE guideline. Published 26 August 2015 Available from www.nice.org.uk/guidance/ng18 [accessed Sept 14, 2018]. 2015.
5. Beck RW, Tamborlane WV, Bergenstal RM,et al. The T1D Exchange clinic registry. J Clin Endocrinol Metab. 2012; 97(12):4383–9.
6. Lado JJ, Lipman TH. Racial and ethnic disparities in the incidence, treatment, and outcomes of youth with type 1 diabetes. Endocrinol Metab Clinics. 2016; 45(2):453–61.
7. Hanberger L, Samuelsson U, Holl RW, et al. Type 1 diabetes during adolescence: International comparison between Germany, Austria, and Sweden. Pediatr Diabetes. 2018; 19(3):506–11.
8. Dovc K, Telic SS, Lusa L, et al. Improved metabolic control in pediatric patients with type 1 diabetes: a nationwide prospective 12-year time trends analysis. Diabetes Technol Ther. 2014; 16(1):33–40.
9. Carlsen S, Skrivarhaug T, Thue G, et al. Glycemic control and complications in patients with type 1 diabetes–a registry-based longitudinal study of adolescents and young adults. Pediatr Diabetes. 2017; 18(3):188–95.
10. LeCaire TJ, Palta M, Klein R, et al. Assessing progress in retinopathy outcomes in type 1 diabetes: comparing findings from the Wisconsin Diabetes Registry Study and the Wisconsin Epidemiologic Study of Diabetic Retinopathy. Diabetes Care. 2012:DC_120863.
11. Miller KM, Foster NC, Beck RW, et al. Current state of type 1 diabetes treatment in the US: updated data from the T1D Exchange clinic registry. Diabetes Care. 2015; 38(6):971–8.
12. Scott A, Whitcombe S, Bouchier D, Dunn P. Diabetes in children and young adults in Waikato Province, New Zealand: outcomes of care. NZ Med J. 2004; 117(1207).
13. Atkinson J, Salmon C, Crampton P. NZDep2013 Index of Deprivation. Department of Public Health, University of Otago. 2014. Available from http://www.otago.ac.nz/wellington/otago069936.pdf [accessed May 17 2018]; 2014.
14. Statistics New Zealand. Urban/Rural Profile Categories: North Island. Wellington, Statistics New Zealand. Available from www.stats.govt.nz [accessed May 16 2018]. 2001.
15. Marathe PH, Gao HX, Close KL. American Diabetes Association Standards of Medical Care in Diabetes 2017. J Diabetes. 2017; 9(4):320–4.
16. Centre for Disease Control (CDC). CDC Growth Charts, available from http://www.cdc.gov/growthcharts/cdc_charts.htm [accessed Dec 10, 2018]. 2016.
17. Laranjeira FO, de Andrade KR, Figueiredo AC, Silva EN, Pereira MG. Long-acting insulin analogues for type 1 diabetes: An overview of systematic reviews and meta-analysis of randomized controlled trials. PloS one. 2018 Apr 12; 13(4):e0194801.
18. McKnight J, Wild S, Lamb M, et al. Glycaemic control of Type 1 diabetes in clinical practice early in the 21st century: an international comparison. Diabetic Med. 2015; 32(8):1036–50.
19. Foster NC, Beck RW, Miller KM, et al. State of Type 1 Diabetes Management and Outcomes from the T1D Exchange in 2016–2018. Diabetes Technol Ther. 2019.
20. Phelan H, Clapin H, Bruns L, et al. The Australasian Diabetes Data Network: first national audit of children and adolescents with type 1 diabetes. Med J Aust. 2017; 206(3):121–5.
21. Rosenbauer J, Dost A, Karges B, et al. Improved metabolic control in children and adolescents with type 1 diabetes: a trend analysis using prospective multicenter data from Germany and Austria. Diabetes Care. 2012; 35(1):80–6.
22. Peterson A, Hanberger L, Åkesson K, et al. Improved results in paediatric diabetes care using a quality registry in an improvement collaborative: a case study in Sweden. PloS One. 2014; 9(5):e97875.
23. Secrest AM, Costacou T, Gutelius B, et al. Associations between socioeconomic status and major complications in type 1 diabetes: the Pittsburgh epidemiology of diabetes complication (EDC) Study. Annals Epidemiol. 2011; 21(5):374–81.
24. Scott A, Toomath R, Bouchier D, et al. First national audit of the outcomes of care in young people with diabetes in New Zealand: high prevalence of nephropathy in Māori and Pacific Islanders. NZ Med J. 2006; 119(1235).
25. Hammes H, Kerner W, Hofer S, et al. Diabetic retinopathy in type 1 diabetes—a contemporary analysis of 8,784 patients. Diabetologia. 2011; 54(8):1977–84.
26. Samuelsson U, Steineck I, Gubbjornsdottir S. A high mean-HbA1c value 3–15 months after diagnosis of type 1 diabetes in childhood is related to metabolic control, macroalbuminuria, and retinopathy in early adulthood—a pilot study using two nation-wide population based quality registries. Pediatr Diabetes. 2014; 15(3):229–35.
27. LeCaire TJ, Palta M, Klein R, et al. Assessing progress in retinopathy outcomes in type 1 diabetes: comparing findings from the Wisconsin Diabetes Registry Study and the Wisconsin Epidemiologic Study of Diabetic Retinopathy. Diabetes Care. 2013; 36(3):631–7.
28. Raile K, Galler A, Hofer S, et al. Diabetic nephropathy in 27,805 children, adolescents, and adults with type 1 diabetes: effect of diabetes duration, A1C, hypertension, dyslipidemia, diabetes onset, and sex. Diabetes Care. 2007; 30(10):2523–8.
29. Brownlee M, Hirsch IB. Glycemic variability: a hemoglobin A1c–independent risk factor for diabetic complications. Jama. 2006; 295(14):1707–8.
30. Lu J, Ma X, Zhou J, et al. Association of time in range, as assessed by continuous glucose monitoring, with diabetic retinopathy in type 2 diabetes. Diabetes Care. 2018; 41(11):2370–6.
31. Jacobs Jr DR, Murtaugh MA, Steffes M, Yu X, Roseman J, Goetz FC. Gender-and race-specific determination of albumin excretion rate using albumin-to-creatinine ratio in single, untimed urine specimens: the Coronary Artery Risk Development in Young Adults Study. AJE. 2002 Jun 15; 155(12):1114–9.
32. Ministry of Health. Children and young people living well and staying well: New Zealand child obesity programme baseline report 2016/17. Wellington: Ministry of Health. Available from www.moh.govt.nz [accessed Jan 08 2019]. 2017.
33. Royal College of Paediatrics and Child Health. National Paediatric Diabetes Audit 2015-16 Report 1: Care Processes and Outcomes. Available from http://www.rcpch.ac.uk/sites/default/files/NPDA_2015-16_audit_report.pdf. 2017.
34. Mottalib A, Kasetty M, Mar JY, et al. Weight Management in Patients with type 1 diabetes and obesity. Curr Diabetes Rep. 2017; 17(10):92.
35. DuBose SN, Hermann JM, Tamborlane WV, et al. Obesity in youth with type 1 diabetes in Germany, Austria, and the United States. J Pediatr. 2015; 167(3):627–32. e4.
36. Maahs DM, Hermann JM, Holman N, et al. Rates of diabetic ketoacidosis: international comparison with 49,859 pediatric patients with type 1 diabetes from England, Wales, the US, Austria, and Germany. Diabetes Care. 2015; 38(10):1876–82.
37. Cameron FJ, Scratch SE, Nadebaum C, et al. Neurological consequences of diabetic ketoacidosis at initial presentation of type 1 diabetes in a prospective cohort study of children. Diabetes Care. 2014; 37(6):1554–62.
38. Donaghue KC, Marcovecchio ML, Wadwa RP, et al. ISPAD Clinical Practice Consensus Guidelines 2018: Microvascular and macrovascular complications in children and adolescents. Pediatr Diabetes. 2018; 19:262–74.
